
Quick Review of the Bacterial Growth Curve
Bacterial growth can be broken down into six distinctive growth phases. A clear understanding of the different growth phases in a bioprocess is important when selecting and improving a bioprocess strategy.
Many scientists say they spend too much time on manual, repetitive tasks for screening experiments and data generation. Manual sampling takes a lot of time, and comes with it’s own set of risks like contamination or sub-optimal microbe growth. Adding to these challenges, the current state of bioprocessing technologies makes it difficult for scientists to study all key parameters throughout the entirety of the experiment.
One key process parameter for any microbial bioprocess is biomass. Biomass in bioprocessing is the concentration of microbial cells in a culture at a given point in time. Most commonly, biomass data is generated via the combination of manual offline sampling and techniques like optical density (OD) or dry cell weight measurements. These invasive methods are highly disadvantageous, causing a person to invest their time to repeatedly interrupt a culture, remove samples, and take measurements using photometers or scales. Despite their disadvantages, manual OD measurements are the current gold standard for biomass monitoring, since the only alternative would be a black box culture without any information about the growth behavior of the strain.
Recently, new, more sophisticated technologies have been developed that can offer more insightful techniques to monitor biomass in microbial cultures. These techniques allow scientists to completely remove the need for manual sampling to monitor biomass. One of the most advantageous principles of measurement is backscatter. Modern backscatter sensors can monitor the biomass non-invasively through the wall of e.g., shake flasks or bioreactors. This online method does not disrupt the bioprocess, nor does it carry the risk of contamination or loss of culture media that comes with manual sampling for biomass. Another benefit of online biomass monitoring with backscatter measurement is that data handling is automatic and continuous. As the microorganisms grow, your data grows in real-time; producing high-resolution growth curves that give you insights into your culture 24/7. With access to more data points and a thorough understanding of the stages of bacterial growth, one can determine inhibiting factors or optimize growth conditions before a problem occurs.
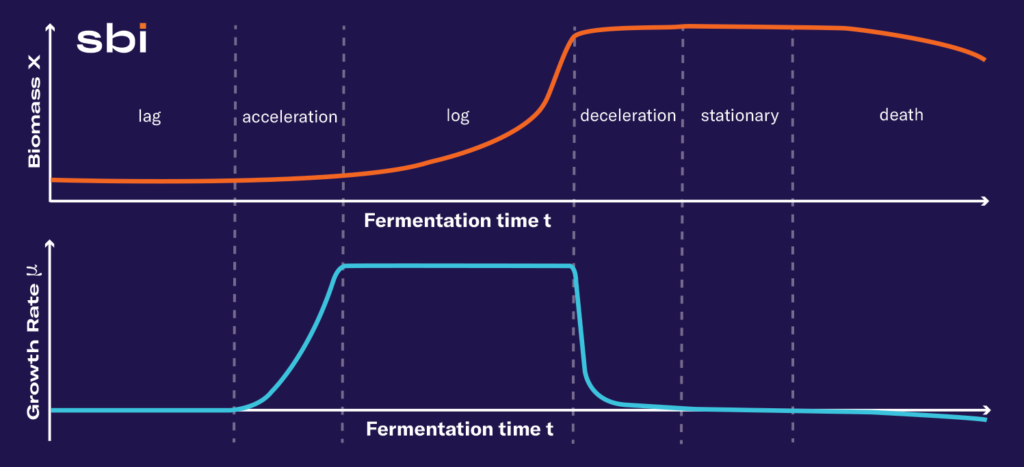
Bacterial growth can be broken down into six distinctive growth phases. A clear understanding of the different growth phases in a bioprocess is important when selecting and improving a bioprocess strategy.
1. Lag Phase:
Characterized by changes in metabolic activity as the microorganisms adapt to surrounding conditions like available nutrients, temperature or pH. There is no increase in the number of cells.
2. Acceleration Phase:
As the cells utilize the media, creating the smaller molecules required for replication, the organisms start to grow and divide, and the biomass slowly increases.
3. Log Phase:
This stage sees the period of quickest growth. Depending on the requirements, the log phase may be extended by the addition of supplemental nutrients.
4. Deceleration Phase:
At this point, the primary nutrition source is exhausted, and cells can no longer continue to grow. The growth rate drops rapidly and the change in biomass slows down.
5. Stationary Phase:
Without additional nutrients, the organisms stop growing and the biomass levels remain constant.
6. Death Phase:
As with all things, without proper nutrients or conditions, the microorganisms start to die resulting in a loss of biomass and a negative growth rate.
Data from manual sampling is often not enough to fully understand the bioprocess. Due to the complex and time-consuming nature of offline sampling, most data points are from pulls at the beginning and end of the experiment. But when nobody is in the lab (e.g. overnight), there are gaps in the growth curves because no samples are being taken. This means that critical information from your growth phases is being overlooked and could have a detrimental impact on your bioprocess and hence final product. Automated online measurements, on the other hand, never miss a moment. More available data points help support scientists with a range of tasks and goals, including:
While nearly any microbial organism can be cultured in a shake flask or bioreactor, they may differ in terms of the natural environment needed to grow and thrive. Each culture will have requirements for growth such as temperature, pH range, mixing requirements, oxygen needs and more. These cells must be screened, cultured, and grown in an environment that promotes growth. By comparing the growth curves of various strains and then of the same strain under various conditions, scientist can create the best fit bioprocess for their application.
Not only must scientists determine the right conditions for their microbe at the start, but they must also be able to monitor these conditions through the life of the culture. Nutrient and chemical changes in the culture can be factors that inhibit growth, resulting in smaller yields.
A major threat for any bioprocess is unwanted contamination. Contamination can be introduced into a system through instruments as well as additives and the effects can be detrimental to your cell culture. Most concerning is that contamination is not always easy to spot, manifesting in many ways and often changing the growth of your cell culture quickly. Infrequent data sampling may not be sufficient to detect a source of contamination.
Modern bioprocesses are often complex and requiring many steps, including cell culture, harvesting, purification and production. How one interacts with the different stages of bacterial growth depends on the end result. If the goal is to learn more about the physiological and regulatory pathways responsible for reproduction, then it might be best to stop a culture earlier during the acceleration phase. However, if the final product is to produce a certain number of cells, then stopping cell culture at the end of the log phase is important. Knowing what stage your cells are can help you time other important functions.
Real time data helps support the result by allowing scientists to respond to cellular needs in real time. High quality data provides better insight as to when it is time to harvest your cells, how often the growth media should be replaced, if dissolved oxygen levels are where they should be for your cell type and experimental objective, and so much more.
Conclusion
Continuous, non-invasive, real-time measurement of biomass in shake flasks and bioreactors takes bioprocessing to the next level. High-resolution growth curves from online biomass monitoring solutions such as the Cell Growth Quantifier (CGQ) allow scientists to evolve their experiments as new challenges emerge. Online biomass solutions provide the reassurance of complete environmental control and comprehensive process information from the start, while removing any manual hands-on-time for time-consuming and repetitive OD measurements.