What Is This Paper About?
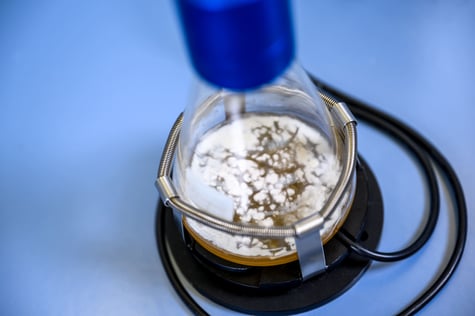
Biomass monitoring of filamentous fungi is particularly challenging because cells tend to form pellets, preventing common optical density measurements. Cell dry weight determination is an invasive and time-consuming process.
The authors of this paper conducted a series of experiments showing that SBI’s Cell Growth Quantifier (CGQ) facilitates biomass monitoring of filamentous fungi and provides reliable and reproducible results. By measuring backscattered light with a high raw data density, the data points delivered by the CGQ represent a complete image of the dynamic liquid distribution and irregular signals, due to pellets in the solution, are equaled out. Thereby, the CGQ enables a thorough characterization of growth patterns of filamentous fungi species.
Want to learn more about the filamentous growth form? Check out our spotlight on filamentous organisms.

The Challenge
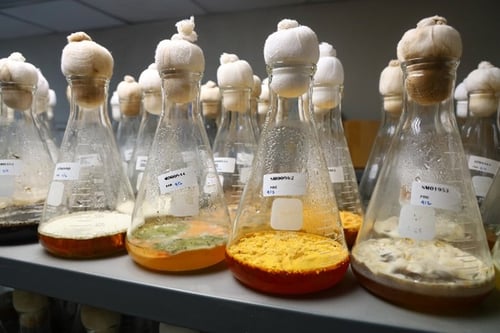
Aspergillus fumigatus is a prominent representative of the filamentous fungi class, ubiquitously appearing as mold, and the cause of diverse human diseases (for example allergenic bronchopulmonary aspergillosis). As a typical filamentous fungus, it forms pellets when grown in liquid cultures. This makes biomass monitoring of the A. fumigatus liquid cultures extremely difficult, as the common optical density measurements (e.g., OD600) are not applicable. Cell dry weight determination is used as an alternative in some cases. However, this method disrupts the process and involves several operating steps, making it time-consuming and overall, not ideal. Therefore, growth behavior in liquid cultures is often not monitored at all.
How The CGQ Measures Biomass
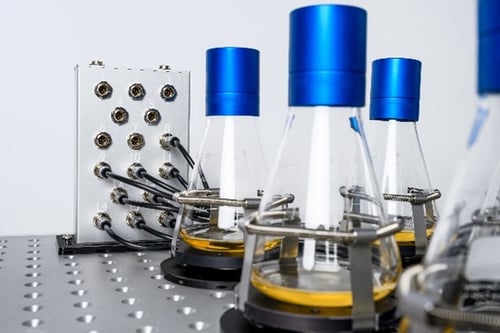
The Cell Growth Quantifier measures the cell density via backscattered light readings. For this, an LED emits light with a central wavelength of 520 nm into the cultivation liquid. A certain amount of this light is scattered back and detected by a diode. The more cells present in the culture, the more light is scattered back, increasing the signal which is digitally collected as a backscatter reading. This process happens very fast. In fact, the dynamic measurement frequency of the CGQ is >500 kHz. That means that up to a million backscatter readings are collected within one measurement cycle (every 1-2 seconds).
Therefore, the CGQ provides a high raw data density and a high resolution of one data point. Whereas static measurements (e.g., with manual sampling) would only provide a locally defined data point which could not depict the average biomass concentration of a non-homogeneous cultivation, data points delivered by the CGQ represent a complete image of the dynamic liquid distribution. Irregular signals can thereby be equaled out. This is important to take different liquid heights due to the shaking movement into account, and it is especially useful when it comes to measuring biomass of cell pellets that do not dissolve well in the medium.
The fully automated, online data acquisition furthermore enables a continuous shaking of the culture, avoiding effects such as sedimentation, oxygen limitation, or metabolic stress. It reduces the time spent by scientists for manual sampling and offers consistent data during all times, including nights and weekends.
CGQ-mediated Growth Tests with A. fumigatus Showed Reliable and Reproducible Results
In the described studies by Ingo Bauer et al., several growth experiments were conducted with the CGQ, testing different A. fumigatus wild type strains, mutants with previously reported growth defects, and different media compositions, imposing e.g., iron or nitrogen limitations. The results showed that the data produced with the CGQ was reliable and reproducible.
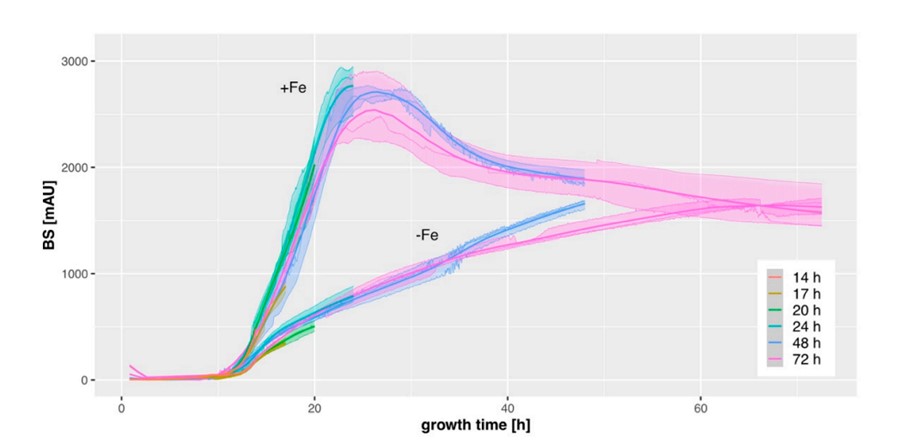 This graph, presented in the paper, depicts the growth curves of an A. fumigatus strain cultivated under iron-rich (+Fe) or iron-poor (-Fe) conditions with differing cultivation times (14-72h, indicated by the different colors) in triplicates. The generally low deviation between triplicates and the similar curves during overlapping time frames show the reproducibility of data demonstrating the strain’s growth behavior.
Manual samples were also taken from monitored cultures at the end of their cultivation times to perform cell dry weight determinations. When compared to the backscatter intensity signals received from CGQ measurements, the researchers saw that the results of these two independent methods generally matched, showing that data from the CGQ can illustrate growth behavior accurately. The positive correlation between both data sets underlines the reliability of the CGQ method.
Cell Morphology
The different nutrient availabilities in the iron-rich and iron-poor (+Fe/-Fe) cultivations influenced the cell morphology, resulting in smaller, but more lacerated pellets observed for the iron-depleted culture conditions in comparison to the iron-rich conditions. The authors observed that this pellet morphology impacts the backscatter intensity signals, as the ratio between the two biomass concentration data sets (CGQ-related / cell dry weight determination) was different for the two culture conditions (+Fe and -Fe). These observations indicated that the smaller fungal pellets, as observed under −Fe conditions, exhibit relatively higher backscattering.
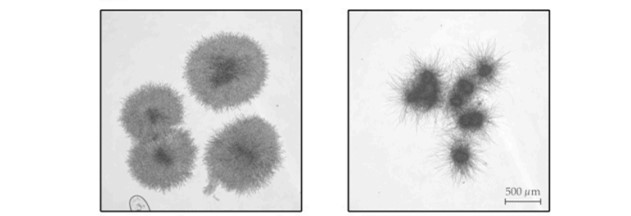
Two different cell morphologies were observed for different culture conditions. The first picture shows cells that were grown under iron-rich conditions. The smaller, more lacerated pellets shown in the second picture were observed for iron-depleted culture conditions.
This observation was in agreement with the findings of the Mie theory, that describes a negative correlation of light scattering and particle volume. Absolute backscatter intensities of cultures with different cell morphologies would therefore be expected to deviate. However, the correlation of backscatter intensities and cell dry weight values was high within one culture condition (Pearson correlation coefficients of 0.95 and 0.99) and culture specific growth trends were clearly visible.
The CGQ Visualizes Different Growth Patterns of A. fumigatus Strains and mutants
The authors also tested different mutant strains of A. fumigatus with known growth defects. These behaviors were well pictured by the CGQ-derived growth curves, demonstrating that it is a valuable tool to visualize different growth patterns of mutant strains.
Furthermore, the growth behavior of the prominent laboratory strain A. fumigatus Af293 was characterized by CGQ measurements. These experiments showed that Af293 displayed different growth patterns compared to three other laboratory A. fumigatus strains, with a delayed peak in maximal growth. This was the first time, such detailed insights into the growth pattern of A. fumigatus Af293 were obtained, emphasizing the value of online biomass monitoring via the CGQ.
Conclusion
The comprehensive data sets provided by Ingo Bauer and associates with this paper show that online biomass monitoring with the CGQ provides robust results and offers further benefits due to its automated and non-invasive operation mode, making it a valuable tool for biomass monitoring of filamentous fungi.
“Taken together, CGQ represents a valuable new tool for the growth curve characterization of filamentous fungal species, strains, and mutants as well as analyzing media compositions.”
- Ingo Bauer et al., 2022