

What Our Customers Are Saying
-Dipl. Ing. Andreas Hoffmann (TU Dresden)
-Winda Soerjawinata (Hochschule Trier)
.png)
How It Works
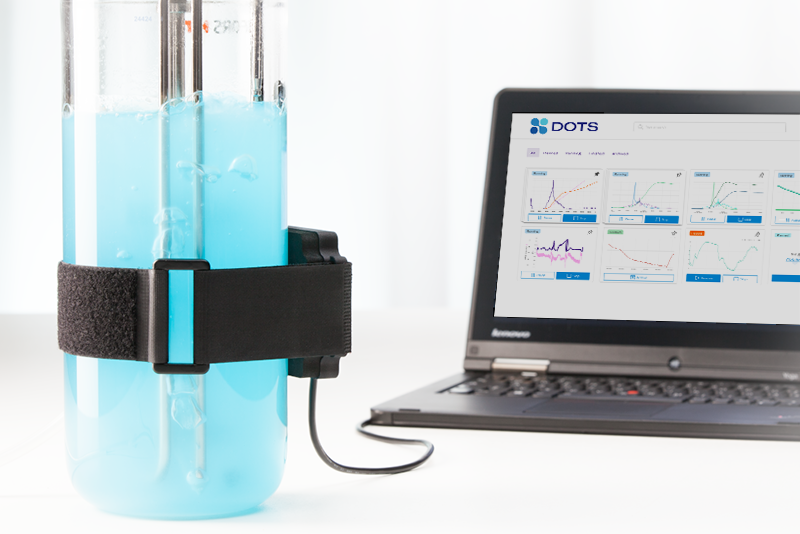
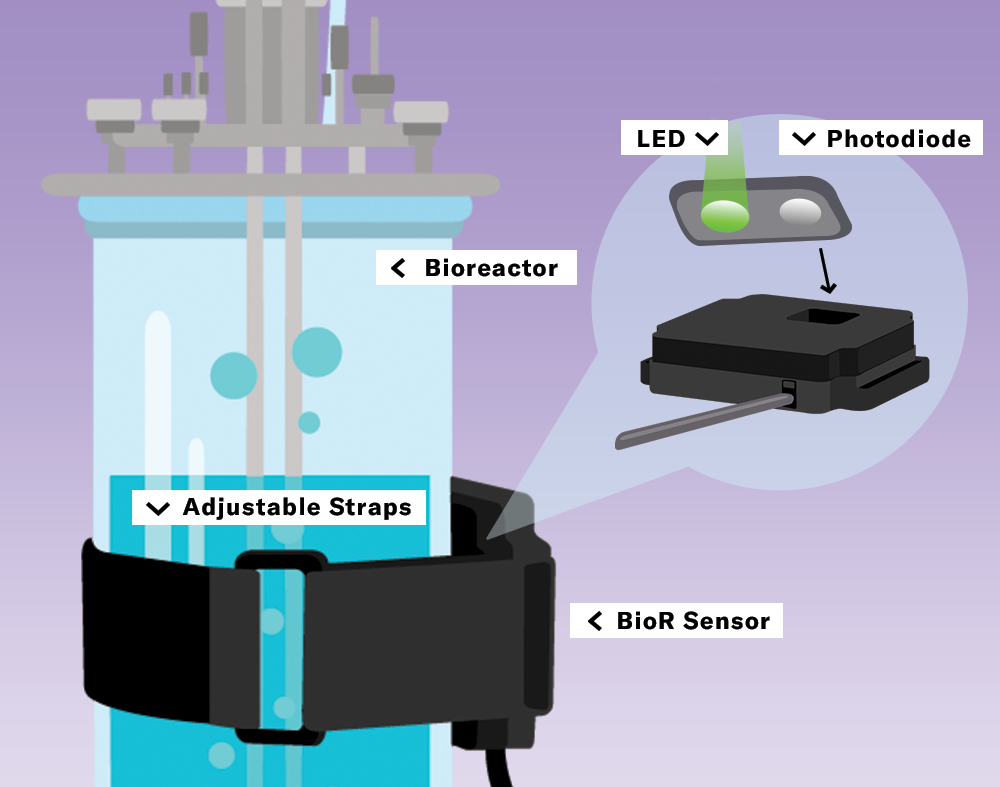
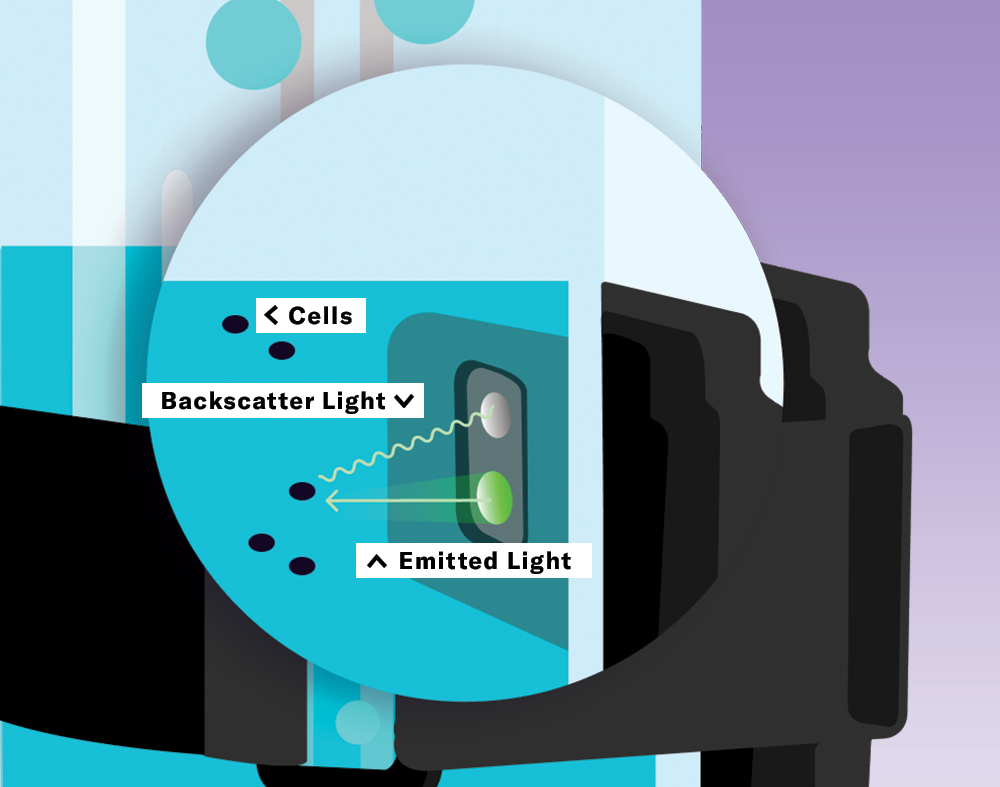
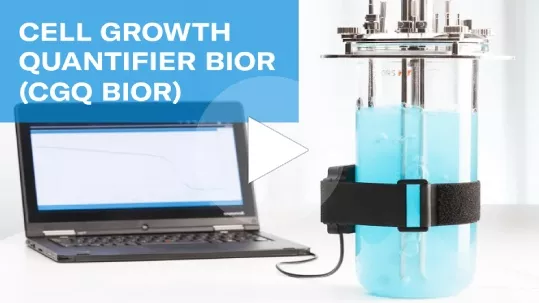
The BioR’s technique for non-invasive cell density monitoring is based on the principle of light backscattering.
Using LEDs and photodiodes, the BioR sensor emits light through the wall of the vessel and measures the amount of light that is scattered back to the photodiode, resulting in a higher measured intensity. The more cells that are in the medium, the more light is scattered back. This backscatter signal can be correlated with offline cell density data, such as OD600 or cell dry weight (CDW).
CGQ BioR Sensing
Architecture
Biomass Monitoring by Backscattered Light

Hardware & Software Components
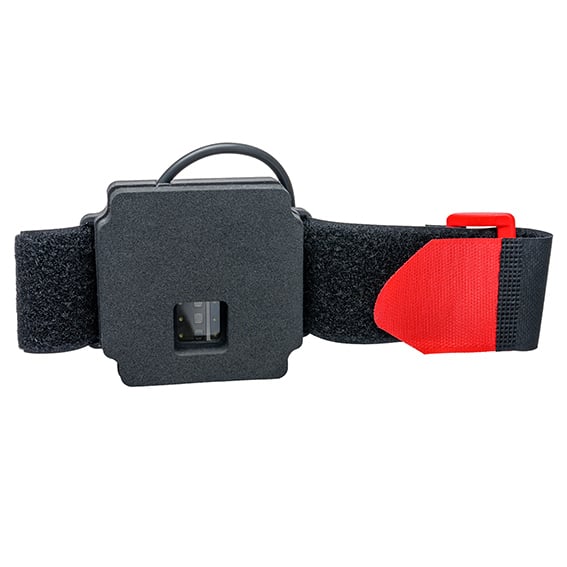
BioR Sensor
BioR Hub
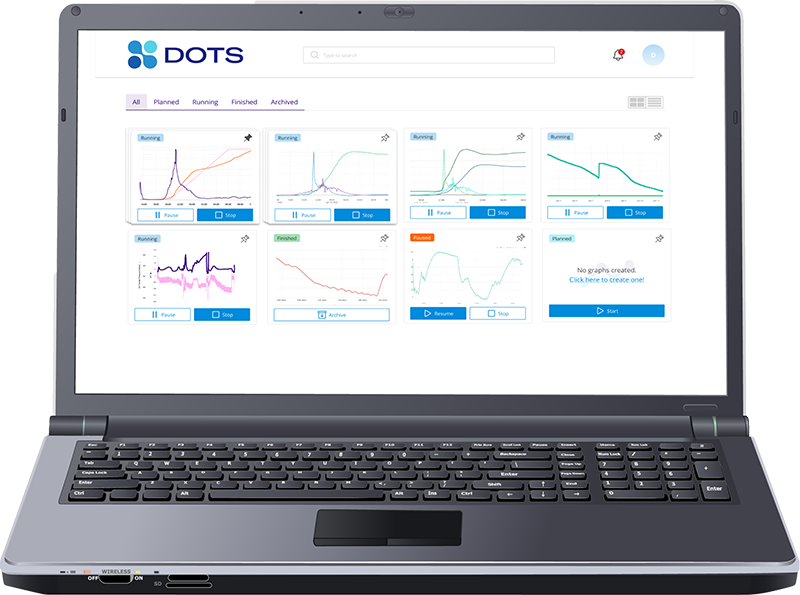
DOTS Software
From Estimation to Information
Why CGQ BioR for your Bioreactors?
Manual sampling-based data is often not sufficient to fully understand the bioprocess. Offline sampling is cumbersome and time-consuming, resulting in lower measurement frequency with most pulls being at the start or the end of the experiment. This means that critical information from your growth phases are being overlooked which could have a detrimental impact on your final product. Automated online measurements, on the other hand, never miss a moment. With high-resolution, real-time growth curves, you can detect bioprocess changes on the spot.
Specifications
Compatible Laboratory Infrastructure
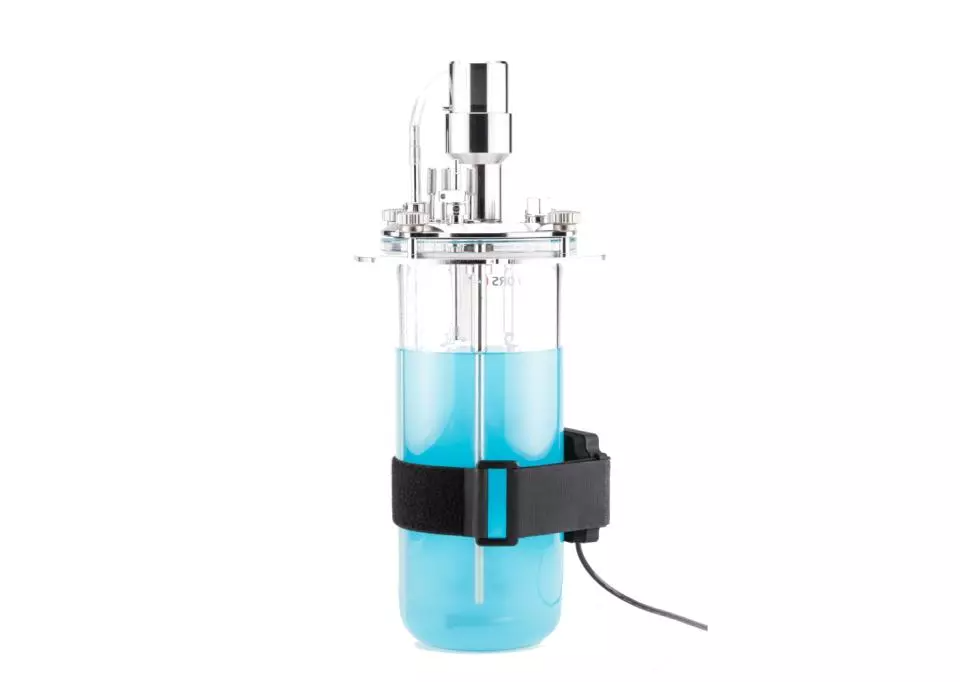
The CGQ BioR is compatible with a variety of bioreactors. Different sized attachment straps provide maximum flexibility, allowing the same sensor to be used with different bioreactor sizes and manufacturers.
For different reactor types:
- Single-jacket
- Double-jacket
For different reactor sizes:
- Mini bioreactor systems
- Benchtop bioreactors
- Production scale
Compatible Organisms
Bacteria
- Escherichia coli
- Corynebacterium glutamicum
- Bacillus subtilis
- Pseudomonas putida
- Pseudomonas taiwanensis
- Gluconobacter oxydans
- Lactobacillus plantarum
- Vibrio natriegens
- Vibrio cholerae
- Staphylococcus aureus
- Klebsiella pneumoniae
- Actinobacillus pleuropneumoniae
- Chromobacterium violaceum
- Blautia producta
- Hungtatella hathewayi
- Prevotella copri
Yeast
- Saccharomyces cerevisiae
- Schizosaccharomyces pombe
- Pichia pastoris
- Yarrowia lipolytica
- Kluyveromyces lactis
- Hansenula polymorpha
- Ustilago maydis
Filamentous organisms
- Aspergillus fumigatus
- Aspergillus nidulans
- Aspergillus niger
- Streptomyces acidiscabies
- Streptomyces venezuelae
- Trichoderma reesei
Archaea
-
Haloferax volcanii
-
Sulfolobus acidocaldarius
Anaerobic organisms
-
Acetobacterium woodii
-
Clostridium aectobutylicum
-
Clostridium ljungdahlii
-
Clostridium difficile
Phototrophic organisms
-
Chlorella vulgaris
-
Scenedesmus obliquus
-
Synechococcus elongatus
-
Nicotiana tabacum BY-2 (plant cells)
Which vessels can I attach the BioR to?
The BioR can be easily strapped onto a wide range of vessel types. The only requirement is that it is either a see-through material (glass, see-through plastic) or - for stainless steel - that it has a transparent window of at least 2 × 2 cm located at the height of the culture broth, allowing the sensor housing to attach securely and optically monitor the fermentation broth. In addition to standard vessels, the BioR is also compatible with various photobioreactors.
Below, you’ll find a non-exhaustive list of bioreactors that are compatible with the BioR, as well as a list of vessel types that are not suitable. If you are unsure whether your vessel can be used with the BioR, our support team will be happy to assist you.
Bioreactors/vessels that the BioR does work with:
-
Infors HT Benchtop Bioreactor Minifors 2
-
Infors HT Benchtop Bioreactor Multifors 2
-
Infors HT Benchtop Bioreactor Labfors 5
-
Sartorius Univessel® Glass Benchtop Bioreactors of all sizes
-
Sartorius Univessel® SU Bioreactors of all sizes
-
Sartorius Ambr® 250 Modular System
-
eppendorf SciVario® twin Benchtop Bioreactors for Microbiology
-
eppendorf BioFlo® 120 Bioreactors
-
eppendorf BioFlo® 320-Bioreaktoren
-
eppendorf BioBLU® c Single-Use Bioreactors 1c, 3c, 10c, 50c
-
eppendorf BioBLU® f Single-Use Bioreactors 1f, 3f, 10f, 50f
-
eppendorf DASGIP® Bioblock/SciVario® twin Stirrer Vessels for microbial applications
-
IKA Habitat all sizes
-
IKA photobioreactor Algaemaster
Bioreactors/vessels that the BioR does not work with:
-
Infors HT Benchtop Bioreactor Techfors
-
Infors HT Benchtop Bioreactor Techfors S
-
eppendorf BioBLU® c Single-Use Bioreactors 0.3c
-
eppendorf BioBLU® f Single-Use Bioreactors 0.3f
Can I use the BioR when I use a heating/water jacket on my bioreactor?
It depends on the design of your heating jacket. If the jacket completely encloses the bioreactor, the CGQ BioR cannot be used. However, many heating jackets do not cover the entire length of the vessel and leave a gap. As long as this gap is at least 2 × 2 cm and the BioR can be mounted directly onto the window without any distance in between, measurements will work reliably.
Please also note that the sensor’s standard operating temperature is up to 45°C. Significantly higher temperatures caused by the heating jacket may damage the sensor.
Can I integrate the data into the software that I am using or do I need to buy the DOTS Software as well?
The BioR allows flexible integration of biomass data into other software platforms (e.g., via analog output or OPC). It can be seamlessly added to your existing infrastructure, including the bioreactor software you already use, without requiring the DOTS Software. Additionally, the DOTS Software is able to create a continuous csv export of the data created, allowing further integration options.
Does the BioR require a port space?
No. Unlike invasive probes that occupy port space, the BioR is completely non-invasive and operates without using or blocking any ports.
What is the difference between high and low biomass modes?
The two modes differ in sensitivity and wavelength. Low biomass mode is optimized for low OD ranges (OD₆₀₀ 0.5–50) and uses a wavelength of 521 nm, while high biomass mode is designed for higher OD ranges (OD₆₀₀ 5–200) and operates at 940 nm. You will need to select the appropriate mode before starting your run, as it is not possible to switch modes once the experiment has begun.
Does the BioR need to be calibrated?
No. The BioR can be strapped onto your vessel and will immediately begin monitoring biomass in arbitrary units (a.u.) — no calibration required.
Does the gassing rate or stirring speed influence my readings?
As an optical sensor, the CGQ BioR measures all optically active particles, including air bubbles in the bioreactor. Consequently, changing conditions—such as when running the reactor in cascadic mode—may interfere with biomass readings. This can often be minimized by adjusting the sensor position. For best results, keep the aeration rate and stirring speed as constant as possible.
Compatible Laboratory Infrastructure
The CGQ BioR is compatible with a variety of bioreactors. Different sized attachment straps provide maximum flexibility, allowing the same sensor to be used with different bioreactor sizes and manufacturers.
For different reactor types:
- Single-jacket
- Double-jacket
For different reactor sizes:
- Mini bioreactor systems
- Benchtop bioreactors
- Production scale
Compatible Organisms
Bacteria
- Escherichia coli
- Corynebacterium glutamicum
- Bacillus subtilis
- Pseudomonas putida
- Pseudomonas taiwanensis
- Gluconobacter oxydans
- Lactobacillus plantarum
- Vibrio natriegens
- Vibrio cholerae
- Staphylococcus aureus
- Klebsiella pneumoniae
- Actinobacillus pleuropneumoniae
- Chromobacterium violaceum
- Blautia producta
- Hungtatella hathewayi
- Prevotella copri
Yeast
- Saccharomyces cerevisiae
- Schizosaccharomyces pombe
- Pichia pastoris
- Yarrowia lipolytica
- Kluyveromyces lactis
- Hansenula polymorpha
- Ustilago maydis
Filamentous organisms
- Aspergillus fumigatus
- Aspergillus nidulans
- Aspergillus niger
- Streptomyces acidiscabies
- Streptomyces venezuelae
- Trichoderma reesei
Archaea
-
Haloferax volcanii
-
Sulfolobus acidocaldarius
Anaerobic organisms
-
Acetobacterium woodii
-
Clostridium aectobutylicum
-
Clostridium ljungdahlii
-
Clostridium difficile
Phototrophic organisms
-
Chlorella vulgaris
-
Scenedesmus obliquus
-
Synechococcus elongatus
-
Nicotiana tabacum BY-2 (plant cells)
Which vessels can I attach the BioR to?
The BioR can be easily strapped onto a wide range of vessel types. The only requirement is that it is either a see-through material (glass, see-through plastic) or - for stainless steel - that it has a transparent window of at least 2 × 2 cm located at the height of the culture broth, allowing the sensor housing to attach securely and optically monitor the fermentation broth. In addition to standard vessels, the BioR is also compatible with various photobioreactors.
Below, you’ll find a non-exhaustive list of bioreactors that are compatible with the BioR, as well as a list of vessel types that are not suitable. If you are unsure whether your vessel can be used with the BioR, our support team will be happy to assist you.
Bioreactors/vessels that the BioR does work with:
-
Infors HT Benchtop Bioreactor Minifors 2
-
Infors HT Benchtop Bioreactor Multifors 2
-
Infors HT Benchtop Bioreactor Labfors 5
-
Sartorius Univessel® Glass Benchtop Bioreactors of all sizes
-
Sartorius Univessel® SU Bioreactors of all sizes
-
Sartorius Ambr® 250 Modular System
-
eppendorf SciVario® twin Benchtop Bioreactors for Microbiology
-
eppendorf BioFlo® 120 Bioreactors
-
eppendorf BioFlo® 320-Bioreaktoren
-
eppendorf BioBLU® c Single-Use Bioreactors 1c, 3c, 10c, 50c
-
eppendorf BioBLU® f Single-Use Bioreactors 1f, 3f, 10f, 50f
-
eppendorf DASGIP® Bioblock/SciVario® twin Stirrer Vessels for microbial applications
-
IKA Habitat all sizes
-
IKA photobioreactor Algaemaster
Bioreactors/vessels that the BioR does not work with:
-
Infors HT Benchtop Bioreactor Techfors
-
Infors HT Benchtop Bioreactor Techfors S
-
eppendorf BioBLU® c Single-Use Bioreactors 0.3c
-
eppendorf BioBLU® f Single-Use Bioreactors 0.3f
Can I use the BioR when I use a heating/water jacket on my bioreactor?
It depends on the design of your heating jacket. If the jacket completely encloses the bioreactor, the CGQ BioR cannot be used. However, many heating jackets do not cover the entire length of the vessel and leave a gap. As long as this gap is at least 2 × 2 cm and the BioR can be mounted directly onto the window without any distance in between, measurements will work reliably.
Please also note that the sensor’s standard operating temperature is up to 45°C. Significantly higher temperatures caused by the heating jacket may damage the sensor.
Can I integrate the data into the software that I am using or do I need to buy the DOTS Software as well?
The BioR allows flexible integration of biomass data into other software platforms (e.g., via analog output or OPC). It can be seamlessly added to your existing infrastructure, including the bioreactor software you already use, without requiring the DOTS Software. Additionally, the DOTS Software is able to create a continuous csv export of the data created, allowing further integration options.
Does the BioR require a port space?
No. Unlike invasive probes that occupy port space, the BioR is completely non-invasive and operates without using or blocking any ports.
What is the difference between high and low biomass modes?
The two modes differ in sensitivity and wavelength. Low biomass mode is optimized for low OD ranges (OD₆₀₀ 0.5–50) and uses a wavelength of 521 nm, while high biomass mode is designed for higher OD ranges (OD₆₀₀ 5–200) and operates at 940 nm. You will need to select the appropriate mode before starting your run, as it is not possible to switch modes once the experiment has begun.
Does the BioR need to be calibrated?
No. The BioR can be strapped onto your vessel and will immediately begin monitoring biomass in arbitrary units (a.u.) — no calibration required.
Does the gassing rate or stirring speed influence my readings?
As an optical sensor, the CGQ BioR measures all optically active particles, including air bubbles in the bioreactor. Consequently, changing conditions—such as when running the reactor in cascadic mode—may interfere with biomass readings. This can often be minimized by adjusting the sensor position. For best results, keep the aeration rate and stirring speed as constant as possible.
Customer Success Stories
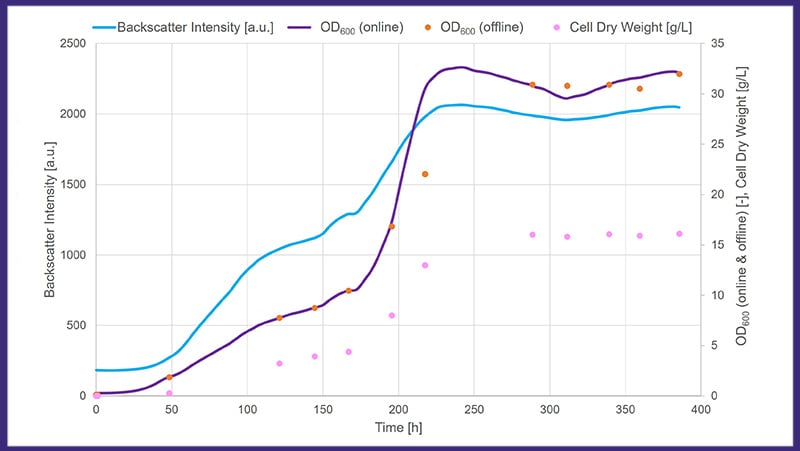
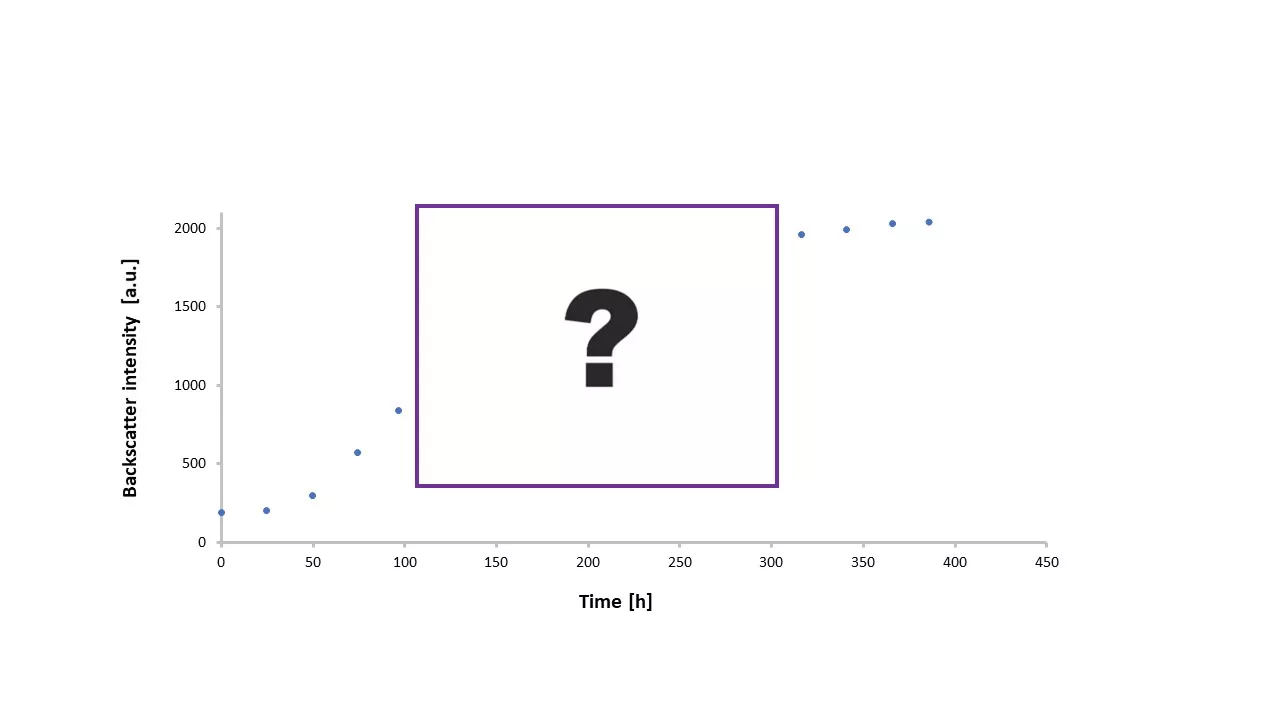
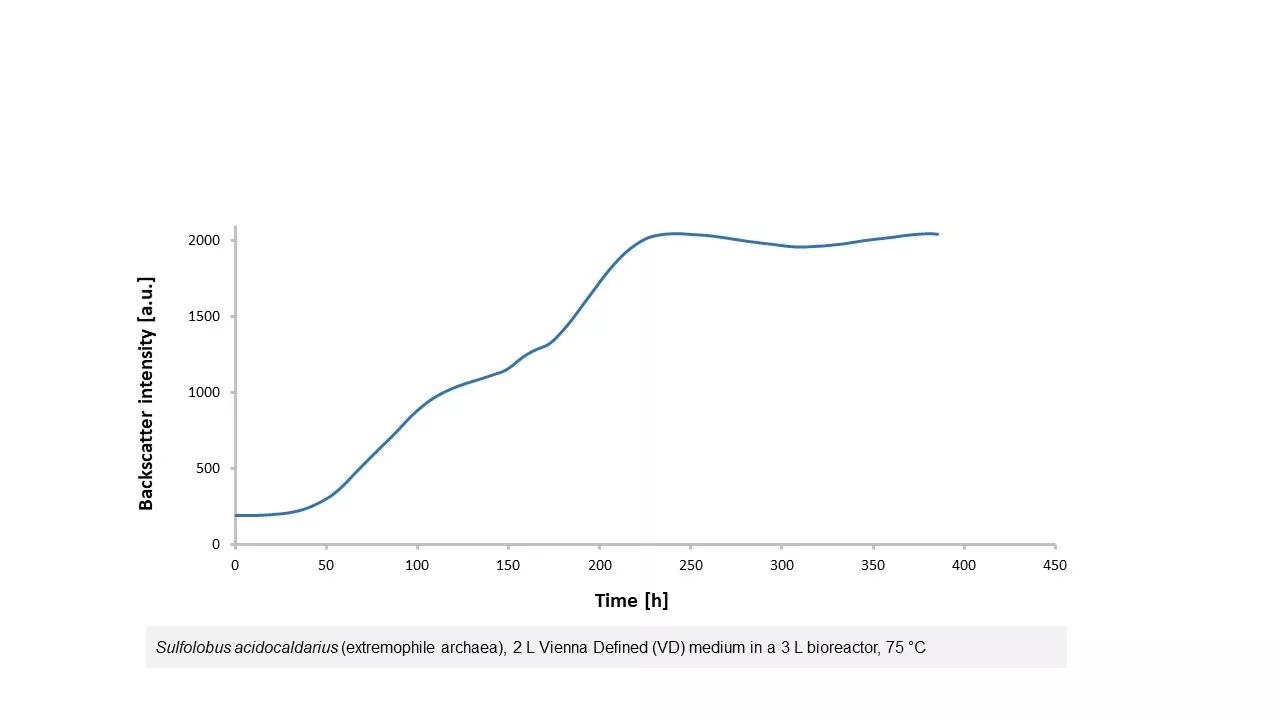
USING THE CGQ BIOR FOR THERMOPHILIC ORGANISMS
"The prolonged exposure to high temperatures was unproblematic for the CGQ BioR. Even after 400 hours of cultivation, the biomass data from the CGQ BioR was highly reliable and correlated well with OD600 and cell dry weight values. The CGQ BioR therefore seems well suited for monitoring biomass of cultivations with thermophilic organisms that require high temperatures and long fermentation times."
- Dipl. Ing. Robert Klausser, Integrated Bioprocess Development, TU Wien
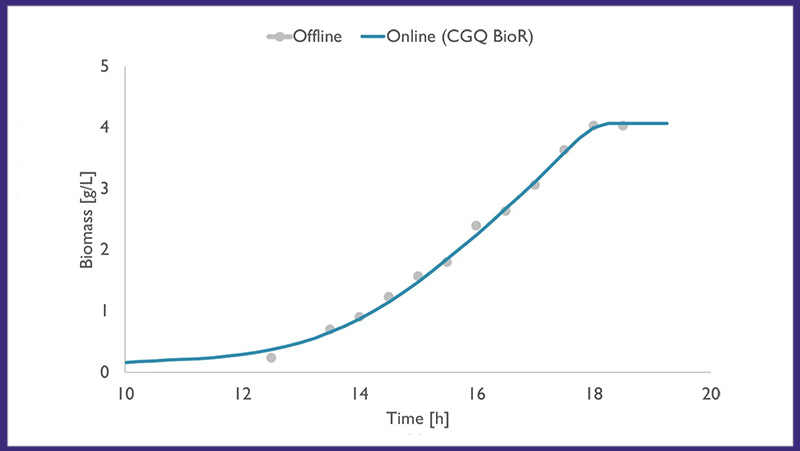
Using The CGQ Bior To Monitor K. Marxianus During The Production Of Ethyl Acetate
Yeasts ferment to produce ethyl acetate (EA), a widely used solvent. In this experiment, Kluyveromyces marxianus was cultivated in a synthetic medium and the CGQ BioR was used to calculate biomass-specific EA synthesis rates to identify optimal production stages.