No Biomass Monitoring
- Forces researchers to accept under-sampled experiments and "black box" shake flasks with limited bioprocess understanding


.png?width=800&height=500&name=Promotor%20Induction%20in%20Pichia%20pastoris%20with%20Biomass-based%20feeding%20(1).png "Promotor Induction in Pichia pastoris with Biomass-based feeding (1)")


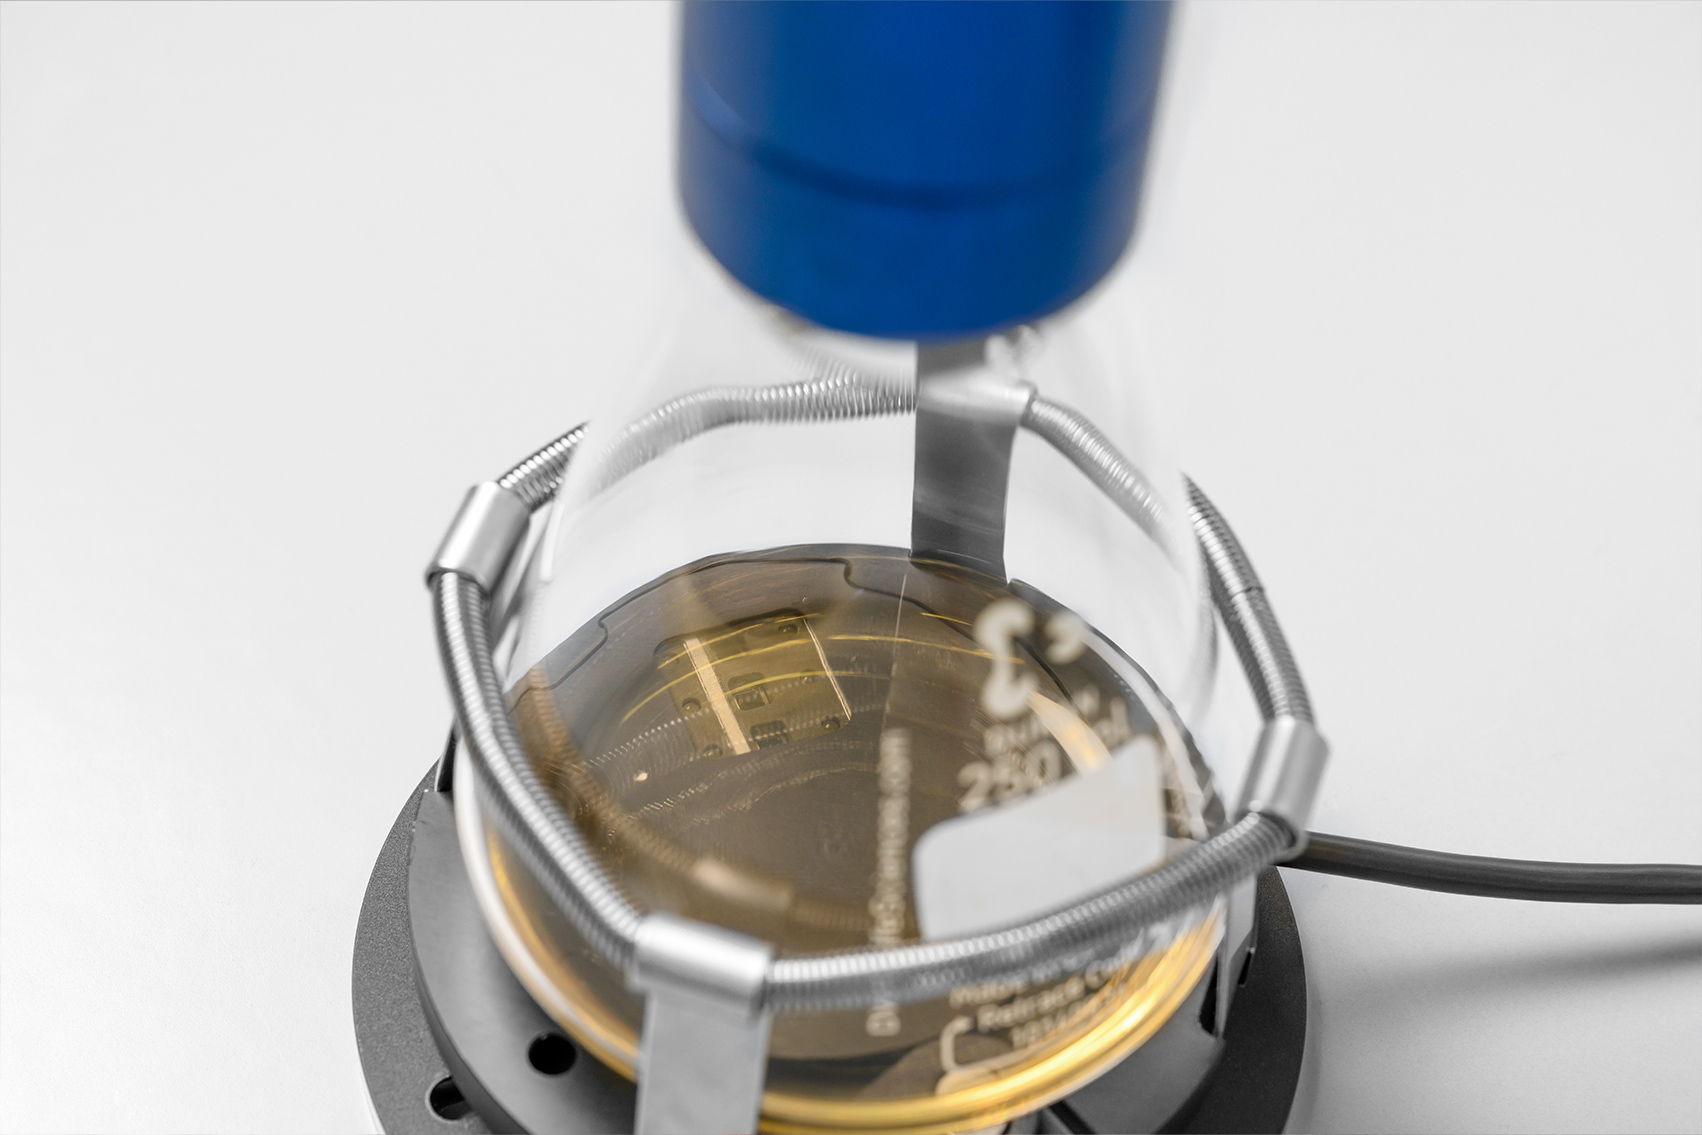
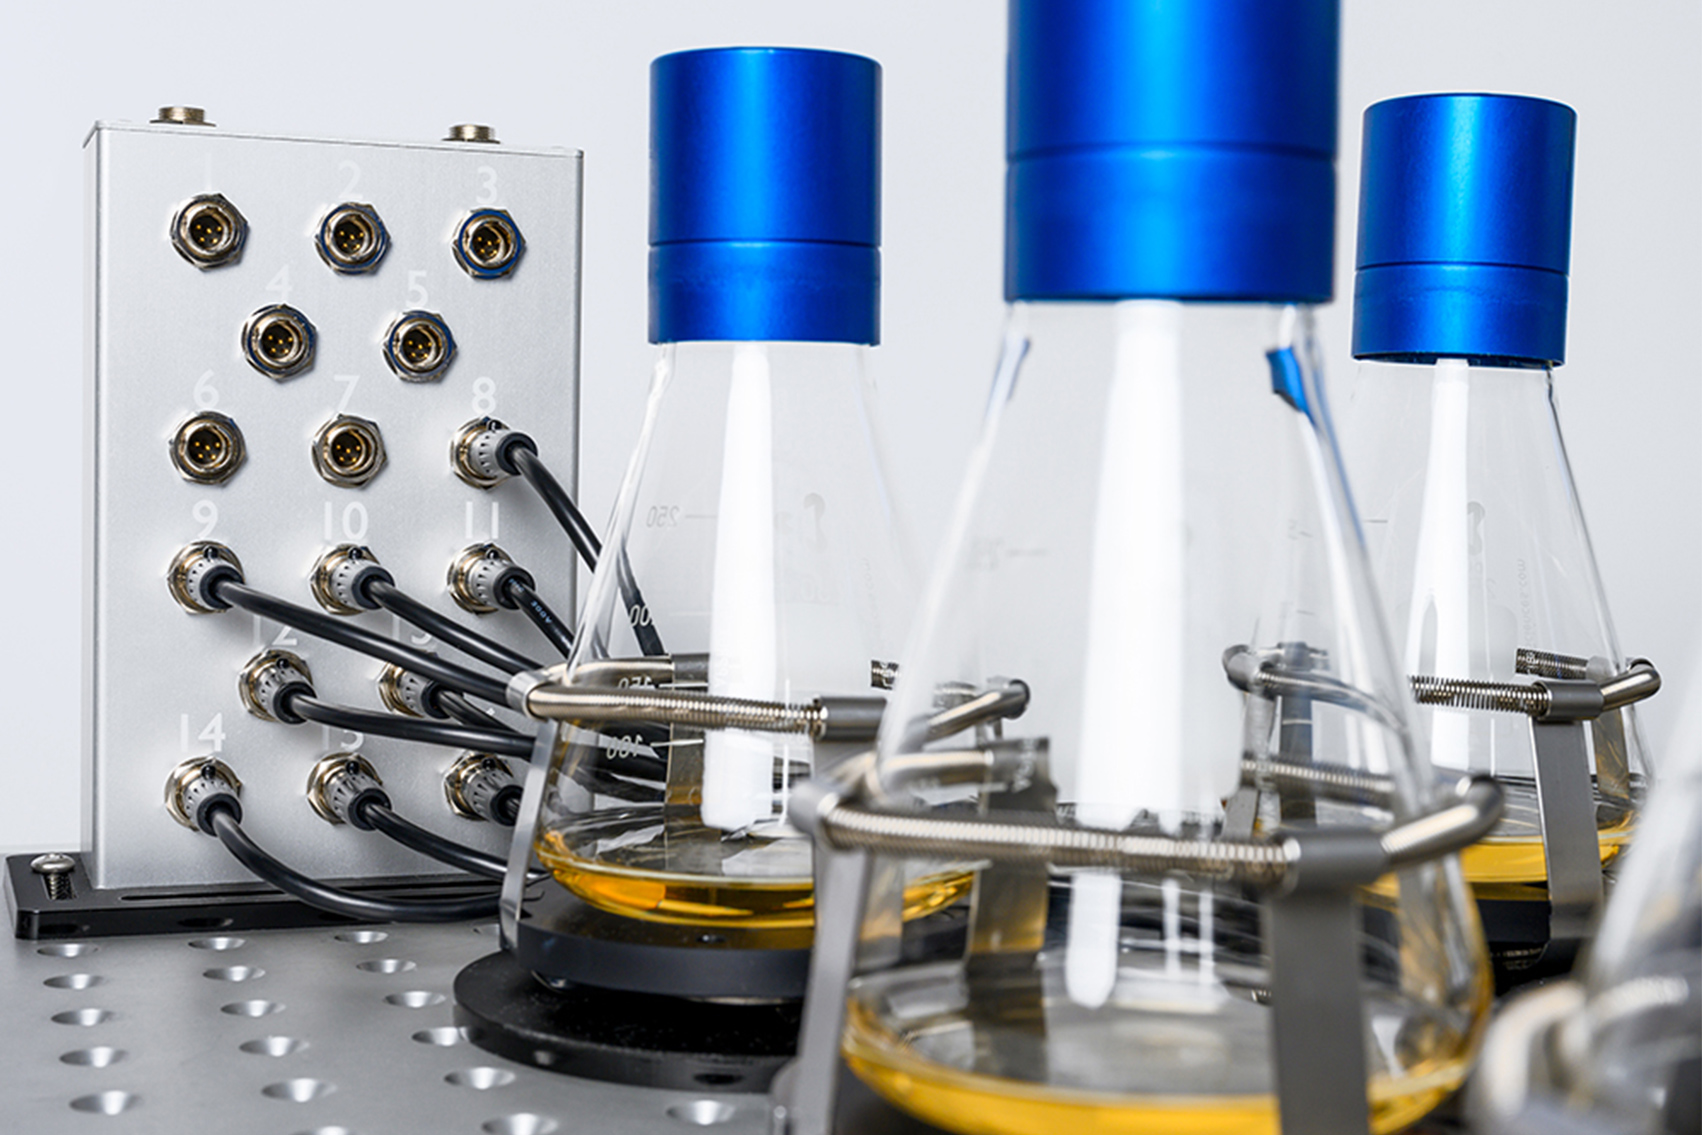
The CGQ is compatible with a variety of vessel types. An available adapter system provides maximum flexibility, allowing the same sensor plate to be used with different shake flask sizes.
Any shake flask size ranging from 100 mL to 5000 mL
Flasks with or without baffles
Glass and single-use flasks
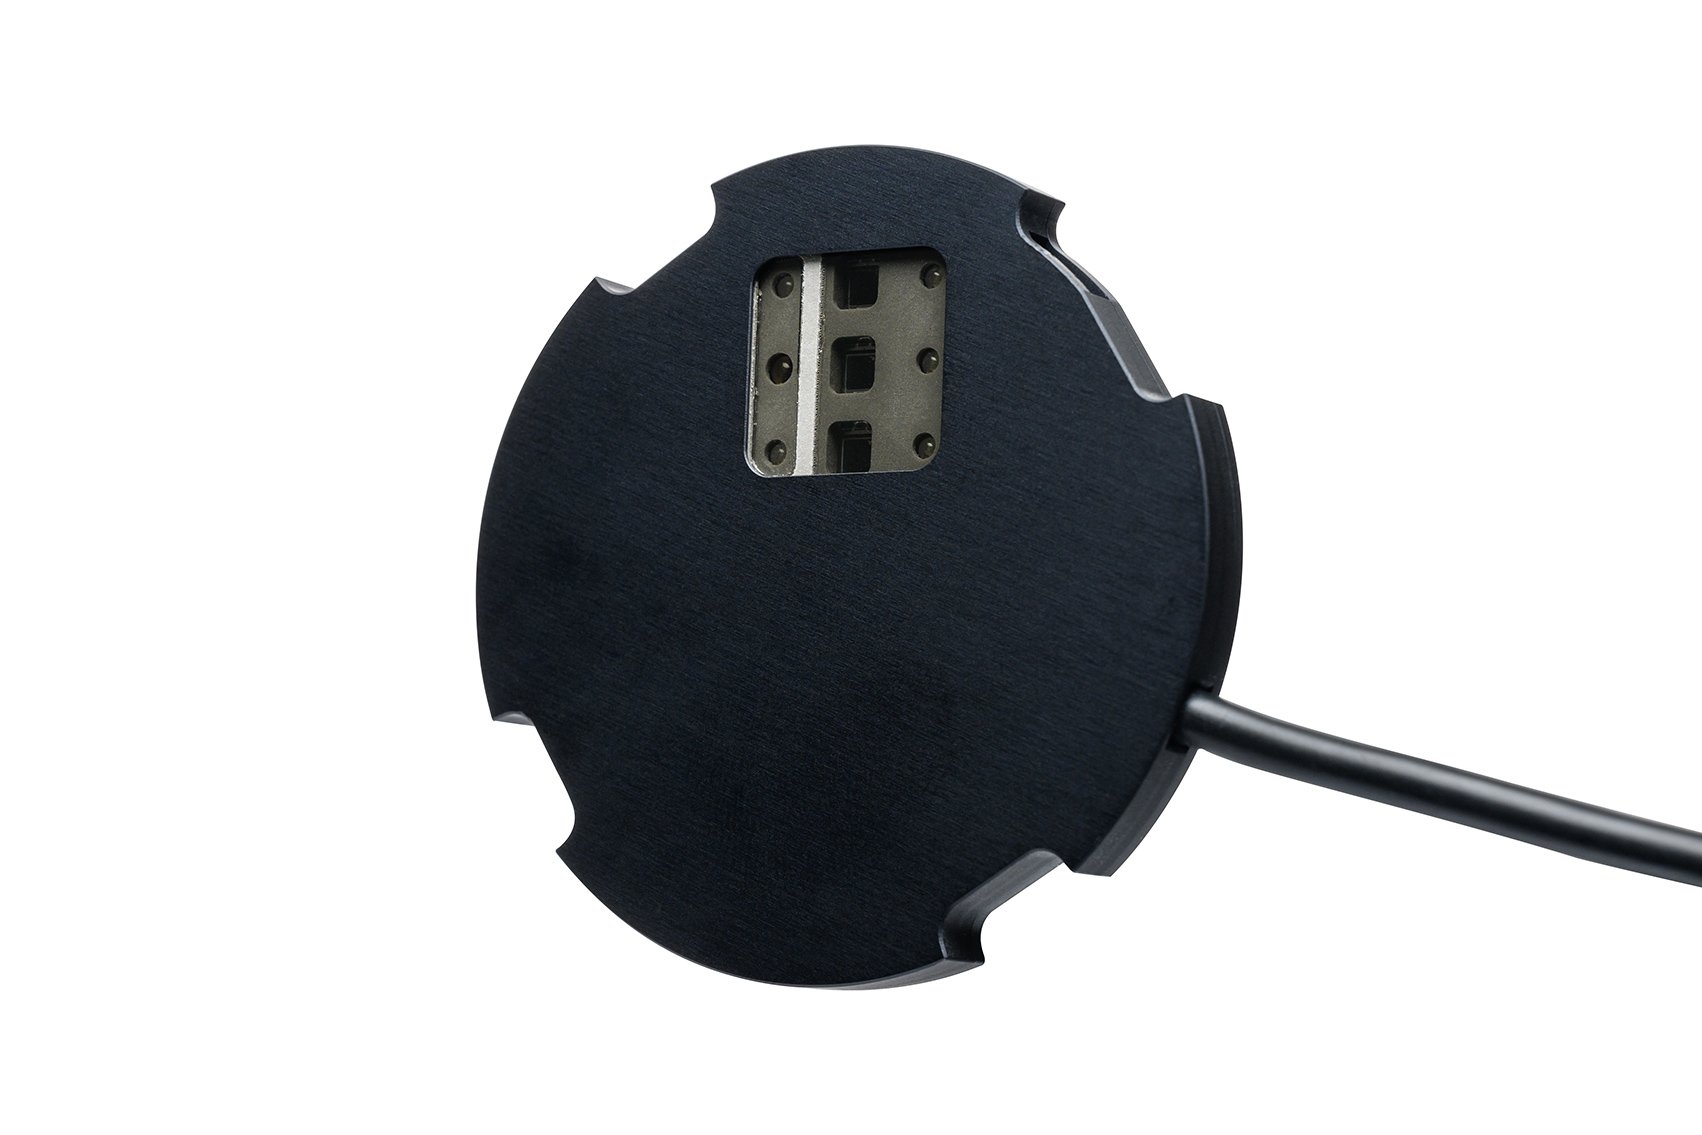
Spring clip and Sticky Mat mounts
Example Organisms Successfully Monitored with CGQ Technology
Escherichia coli
Corynebacterium glutamicum
Bacillus subtilis
Pseudomonas putida
Pseudomonas taiwanensis
Gluconobacter oxydans
Lactobacillus plantarum
Vibrio natriegens
Vibrio cholerae
Staphylococcus aureus
Klebsiella pneumoniae
Actinobacillus pleuropneumoniae
Chromobacterium violaceum
Blautia producta
Hungtatella hathewayi
Prevotella copri
Saccharomyces cerevisiae
Schizosaccharomyces pombe
Pichia pastoris
Yarrowia lipolytica
Kluyveromyces lactis
Hansenula polymorpha
Ustilago maydis
Aspergillus fumigatus
Aspergillus nidulans
Aspergillus niger
Streptomyces acidiscabies
Streptomyces venezuelae
Trichoderma reesei
Haloferax volcanii
Sulfolobus acidocaldarius
Acetobacterium woodii
Clostridium aectobutylicum
Clostridium ljungdahlii
Clostridium difficile
Chlorella vulgaris
Scenedesmus obliquus
Synechococcus elongatus
Nicotiana tabacum BY-2 (plant cells)
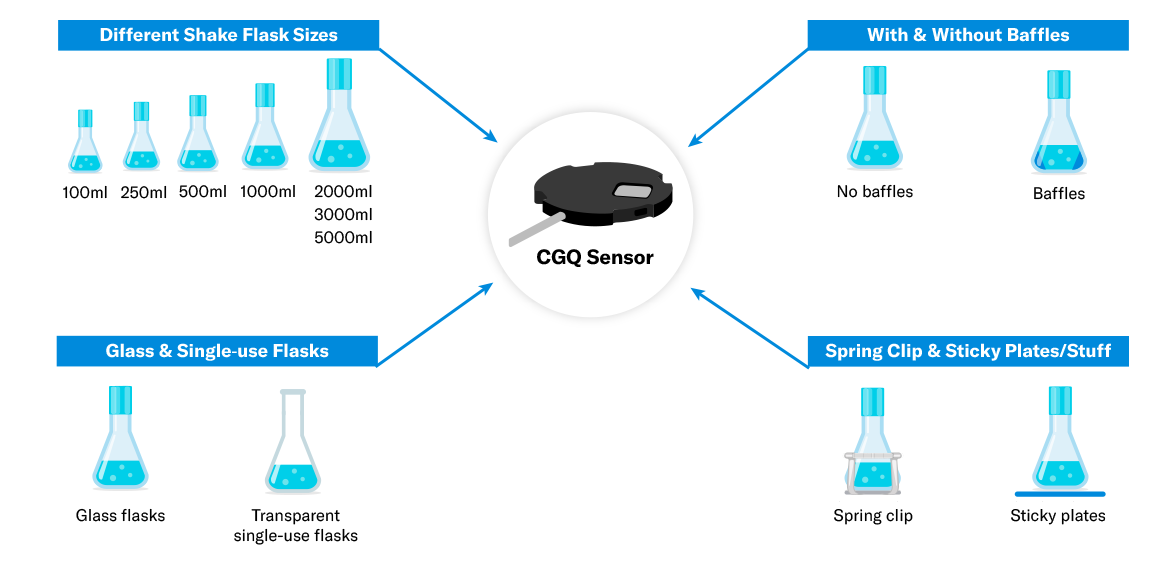
The CGQ is compatible with a variety of vessel types. An available adapter system provides maximum flexibility, allowing the same sensor plate to be used with different shake flask sizes.
Any shake flask size ranging from 100 mL to 5000 mL
Flasks with or without baffles
Glass and single-use flasks
Spring clip and Sticky Mat mounts
Example Organisms Successfully Monitored with CGQ Technology
Escherichia coli
Corynebacterium glutamicum
Bacillus subtilis
Pseudomonas putida
Pseudomonas taiwanensis
Gluconobacter oxydans
Lactobacillus plantarum
Vibrio natriegens
Vibrio cholerae
Staphylococcus aureus
Klebsiella pneumoniae
Actinobacillus pleuropneumoniae
Chromobacterium violaceum
Blautia producta
Hungtatella hathewayi
Prevotella copri
Saccharomyces cerevisiae
Schizosaccharomyces pombe
Pichia pastoris
Yarrowia lipolytica
Kluyveromyces lactis
Hansenula polymorpha
Ustilago maydis
Aspergillus fumigatus
Aspergillus nidulans
Aspergillus niger
Streptomyces acidiscabies
Streptomyces venezuelae
Trichoderma reesei
Haloferax volcanii
Sulfolobus acidocaldarius
Acetobacterium woodii
Clostridium aectobutylicum
Clostridium ljungdahlii
Clostridium difficile
Chlorella vulgaris
Scenedesmus obliquus
Synechococcus elongatus
Nicotiana tabacum BY-2 (plant cells)
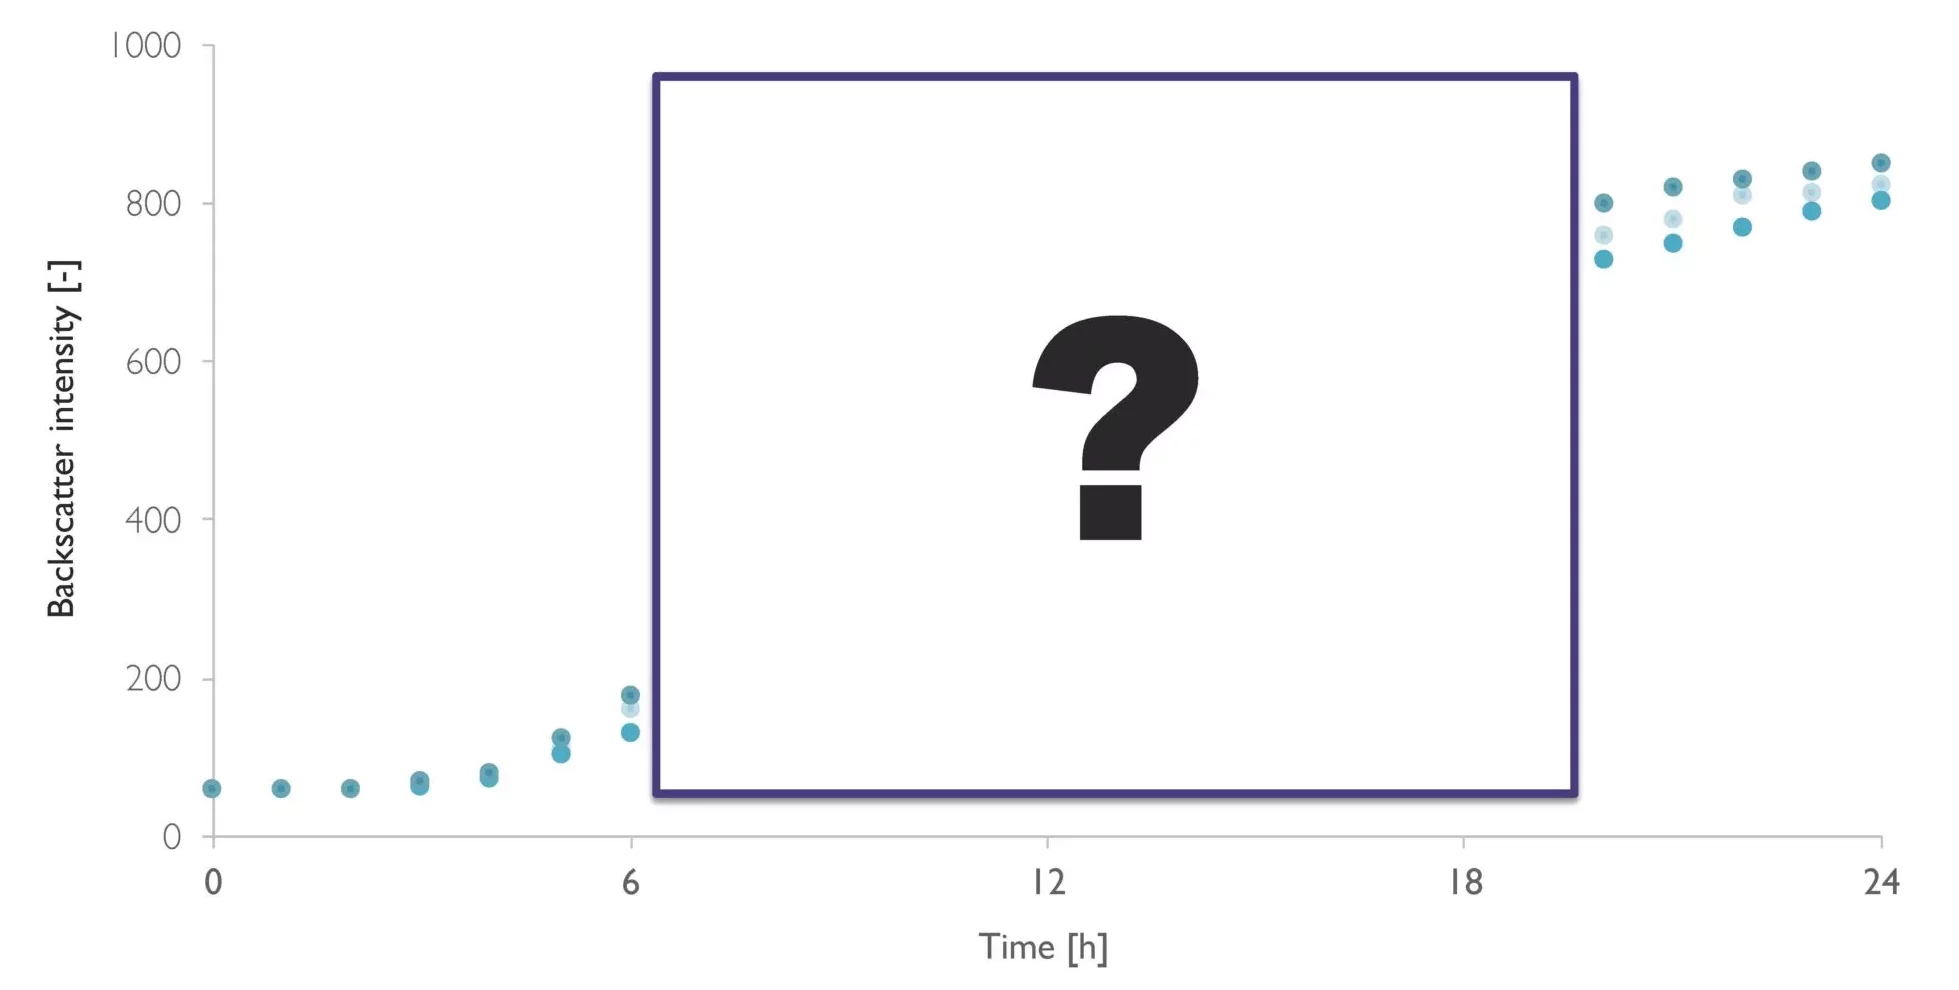
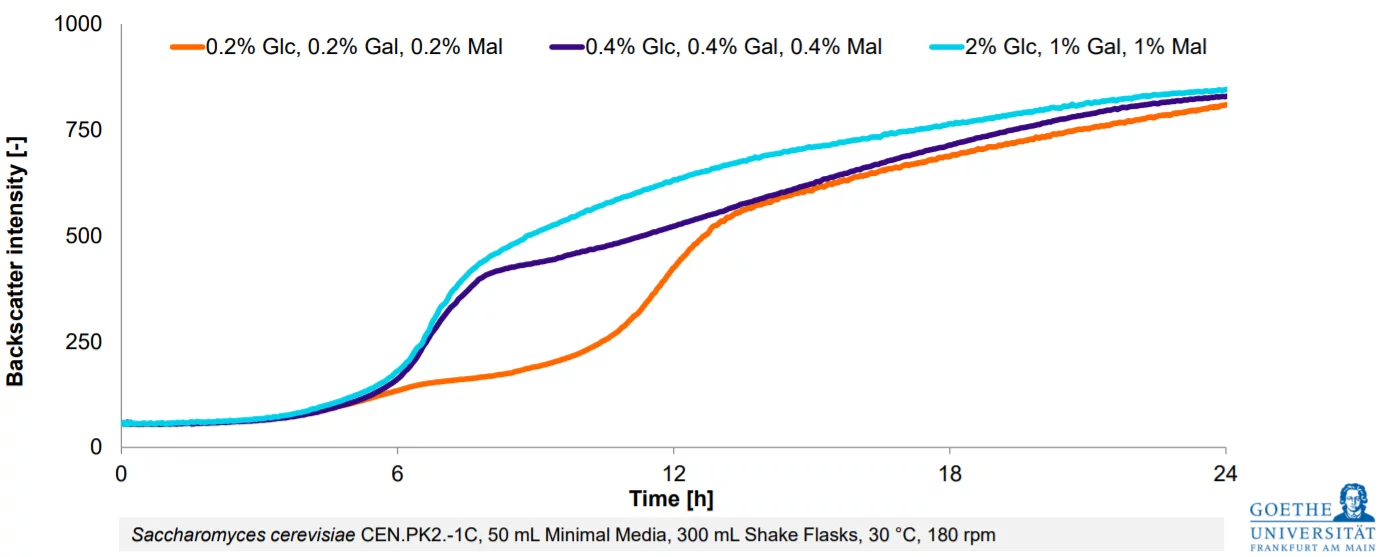
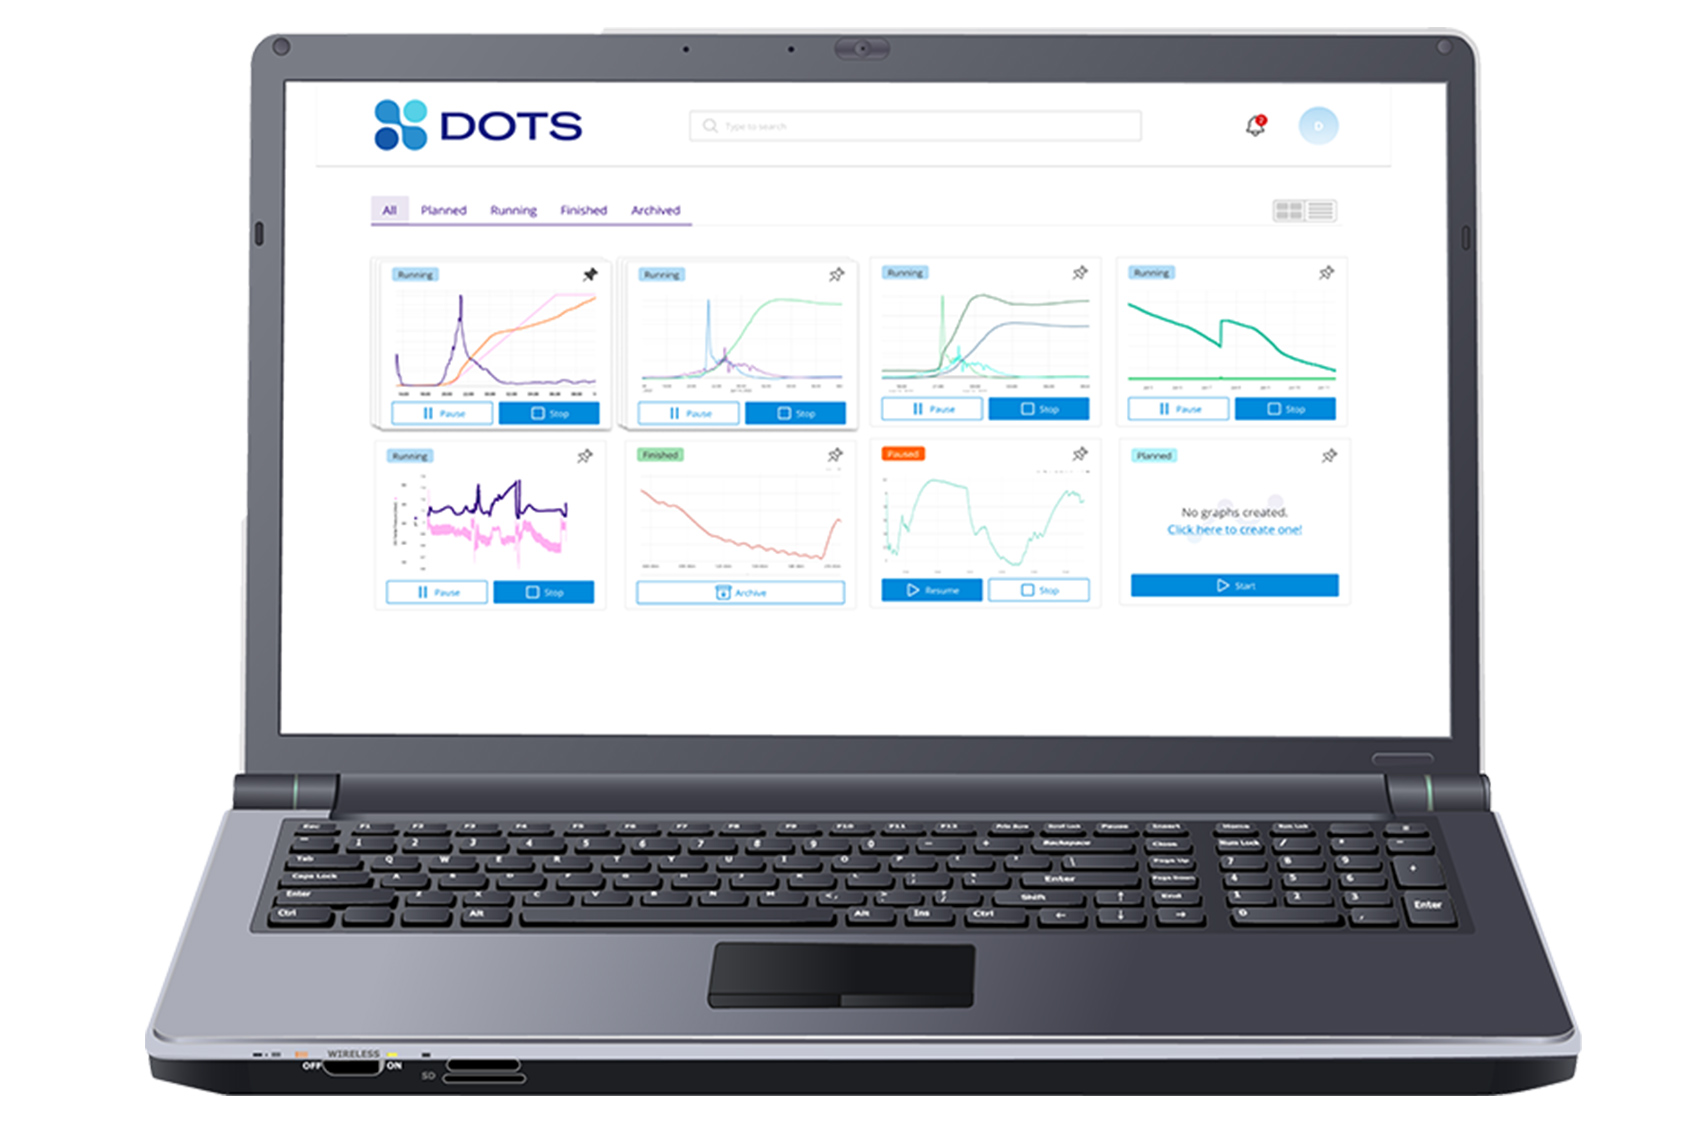
Manual sampling-based data is often not sufficient to fully understand the bioprocess. Offline sampling is complex and time consuming, resulting in lower measurement frequency with most pulls being at the start or the end of the experiment. This means that critical information from your growth phases are being overlooked, and could have a detrimental impact on your final product. Automated online measurements, on the other hand, never miss a moment. With a high resolution growth curve, you can detect bioprocess changes in real-time.