Overview

Key Facts
University: TU Wien, Integrated Bioprocess Development
Location: Vienna, Austria
Employees: 21
Research focus: Bioprocess Development
Organism: Sulfolobus acidocaldarius (and more)

Creating Process Understanding
The research group of Integrated Bioprocess Development (IBD), led by Prof. Oliver Spadiut at the Technical University in Vienna (TU Wien), wants to fully understand bioprocesses in their entity. Dedicated scientists get involved in every step, from the ideation (identification of interesting products) to the final product (product purification and characterization).
Microbial fermentations in bioreactors represent a focus area of their work, including optimizations of bioprocesses with extremophile archaea.
One successful outcome of these efforts has been, for example, the optimization of media compositions that allows for a better growth of Sulfolobus acidocaldarius, an important model organism of the archaea domain.
The IBD group tries to further improve fermentations with Sulfolobus acidocaldarius by implementing modern monitoring and control equipment to measure Critical Process Parameters (CPPs).
The Challenge
Sulfolobus acidocaldarius is a thermoacidophilic archaeon which means that it grows best under extreme temperatures and pH conditions. In fact, its optimal growth temperature lies between 75 – 80 °C and it furthermore enjoys extremely acidic environments with pH values as low as pH 2-3. Its slow growth results in long fermentations of more than 400 hours (17 days). These extreme fermentation conditions have led to certain challenges when it comes to measuring biomass.
Online biomass monitoring is indispensable for successful bioprocesses for several reasons:
1) Critical process parameters such as the biomass concentration need to be controlled tightly to achieve quality by design, a concept relying on constant parameter control during production processes to avoid failures at early stages and ultimately improve the quality of the final product. Manual sampling cannot provide the real-time information required for in-depth process control.
2) Manual sampling introduces the influence of the operator as an inconsistent factor and possible error source to the process.
3) For the future goal of modeling, and the creation of digital twins for bioprocesses, a wealth of data is required that the low frequency of manual sampling simply cannot provide.
Therefore, automated, online biomass monitoring must be established for these fermentations.
However, when testing a standard probe, the group observed that the received biomass data contained very little signal and mostly noise. It is likely that the extreme conditions of 75 °C and pH 2 – 3 within the bioreactor were not compatible with the measuring principle.
Challenges of Manual Sampling
Low-resolution data
![]() Time-consuming
Time-consuming
![]() Invasive sampling methods
Invasive sampling methods
![]() Increased risk of contamination
Increased risk of contamination
![]() Increase in human error
Increase in human error
Challenges of Online Biomass Monitoring with Thermophilic Organisms
Noisy signals with standard probes
![]() Extreme temperatures affect measuring devices
Extreme temperatures affect measuring devices
The Solution
Robert Klausser, a Master student of the IBD group, used the CGQ BioR for a fermentation with Sulfolobus acidocaldarius to evaluate the biomass data quality under the conditions required for this organism.
For this, a 3 L bioreactor was filled with 2 L Vienna Defined (VD) medium, in which the pH was adjusted to 3, and the medium was inoculated with Sulfolobus acidocaldarius cells to reach an initial OD600 of 0.107. The temperature was adjusted to 75 °C and biomass was measured by three different methods throughout the extended fermentation time of 400 hours.
Results
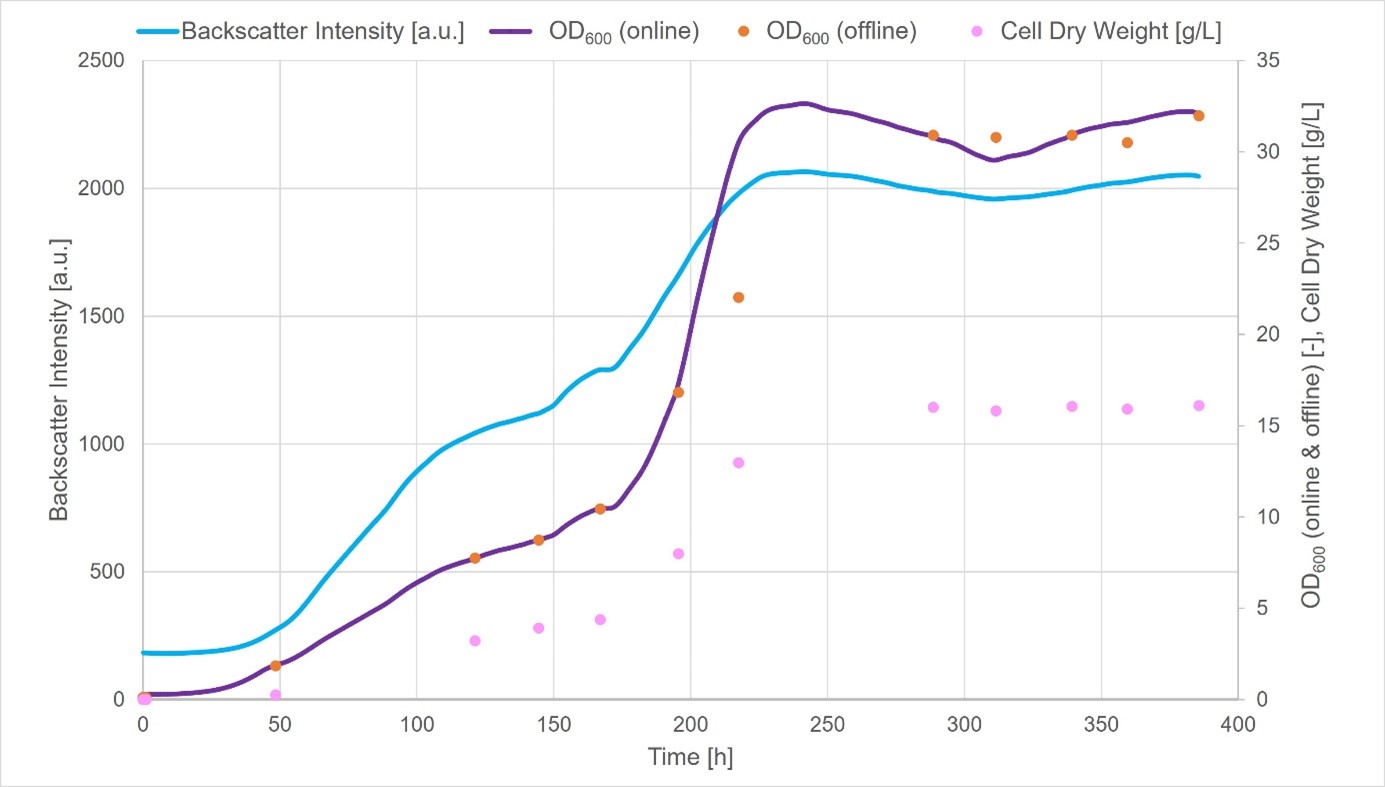
Backscatter intensity was measured online with the CGQ BioR. In addition, OD600 values and cell dry weight (CDW, in g/l) was determined every 1-2 days, manually. By using the calibrator tool, provided by the Software, the determined OD600 values were correlated with the monitored backscatter intensity values, resulting in an online OD600 graph.

The Conclusion
The CGQ BioR represents the ideal tool for monitoring the biomass of thermophilic organisms.
All three values (backscatter intensity, CDW, and OD600) correlated well throughout the entire length of the cultivation. Even after 400 hours, the data received from the CGQ BioR was steady and reliable, proving the high thermostability of the sensor. This experiment, therefore, shows that backscattered light readings with the CGQ BioR provide reliable data even under severe conditions, under which other methods struggle to perform well.
Want Results Like These?
We will work with you on a solution that works best for your application.
Testimonial
"The prolonged exposure to high temperatures was unproblematic for the CGQ BioR. Even after 400 hours of cultivation, the biomass data from the CGQ BioR was highly reliable and correlated well with OD600 and cell dry weight values. The CGQ BioR therefore seems well suited for monitoring biomass of cultivations with thermophilic organisms that require high temperatures and long fermentation times."
- Dipl. Ing. Robert Klausser, Integrated Bioprocess Development, TU Wien
From Estimation To High-Resolution Growth Curves


Customer Success Stories
.png)
-Kitana Manivone Kaiphanliam (Washington State University)

.png)
%20(1).jpg)